GPU Accelerated Stream Compaction
CPU & GPU implementation of stream compaction, written in C++ and CUDA.
Tested on: Windows 11, i5-11600K @ 3.91GHz 32GB, RTX 2060 6GB (Personal Desktop)
Description
This project contains the following implementations:
- CPU implementation of scan and string compaction.
- Naive GPU implementation of scan.
- Work-Efficient GPU implementation of scan and string compaction.
- Thread number optimization on work-efficient GPU implementation
The scan and string compaction algorithm implemented are based on GPU Gems 3 Chap.39 Parallel Prefix Sum with CUDA.
Analysis
1. Block Size Optimization
To determine the optimum block size for both naive and efficient GPU scan, I performed a exponential scan on block size and measure the time cost at different block size.

Time Cost vs. Block Size
| block size | 1 | 2 | 4 | 8 | 16 | 32 | 64 | 128 | 256 | 512 | 1024 |
|---|---|---|---|---|---|---|---|---|---|---|---|
| naive (ms) | 1077.99 | 608.779 | 357.073 | 197.336 | 110.639 | 58.122 | 30.6088 | 27.9214 | 27.9087 | 28.1457 | 29.4622 |
| efficient (ms) | 109.593 | 64.3612 | 32.4774 | 20.6583 | 13.6459 | 13.546 | 13.7829 | 13.4237 | 13.3781 | 13.716 | 13.6309 |
We can see that the time cost of both implementations drop as block sizes increase. The time cost of the naive implementation reaches a plateau at round 64, while the efficient implementation reaches a plateau at round 16. When block size is 256, both implementation reach their optimum. Therefore, we will choose 256 as the block size for all comparisons.
An interesting phenomenon observed is that the performance of the efficient implementation stops improving when block size is 16, which is smaller than the maximum number of threads allowed in a wrap. Without further profiling, I might hit a point where memory coarsening is optimal for a block size of 16.
2. Comparison of GPU & CPU Implementations of Scan
With optimum block size, all implementations are tested against the length of the input array.

Time Cost vs. Size of Array
| log(array length) | 21 | 22 | 23 | 24 | 25 | 26 | 27 | 28 | 29 | 30 |
|---|---|---|---|---|---|---|---|---|---|---|
| CPU | 0.8013 | 1.5922 | 3.1945 | 6.4031 | 12.6507 | 25.3825 | 51.2388 | 98.7369 | 234.998 | 394.874 |
| GPU (Naive) | 1.48966 | 4.04874 | 6.53651 | 14.7808 | 28.2829 | 56.4302 | 121.065 | 250.27 | 526.096 | 14634.9 |
| GPU (Work-Efficient) | 1.03702 | 1.69731 | 3.36416 | 7.0199 | 13.6784 | 27.2429 | 52.4784 | 104.398 | 209.717 | 418.342 |
| GPU (Thrust) | 0.485376 | 0.519936 | 0.72192 | 0.979072 | 1.81453 | 2.75165 | 4.78301 | 9.24336 | 16.9555 | 516.865 |
We can see that on average, Thrust implementation is significantly faster than any other implementations. CPU and work-efficient implementations are about the same performance, while the naive GPU implementation has the worst performance.
The fact that the naive GPU implementation is slower than the GPU implementation is anticipated, since there are much more algorithmic computation involved in the naive GPU implementation, while no shared memory is used in the naive implementation.
The work-efficient GPU implementation, however, is much better than the naive implementation in a sense that it lowers the algorithmic complexity down to \(O(n)\) and can finish in \(O(\log n)\) given unlimited parallelism.
3. Result & Bottleneck Analysis
To identify the bottlenecks for GPU implementations, we use NVIDIA Nsight Compute to profile our tests and gathered metrics for each kernel call. We also used NVIDIA Nsight Systems to view the trace for all imeplemtations.
- Nsight System Trace for Naive & Work-Efficient Implementation
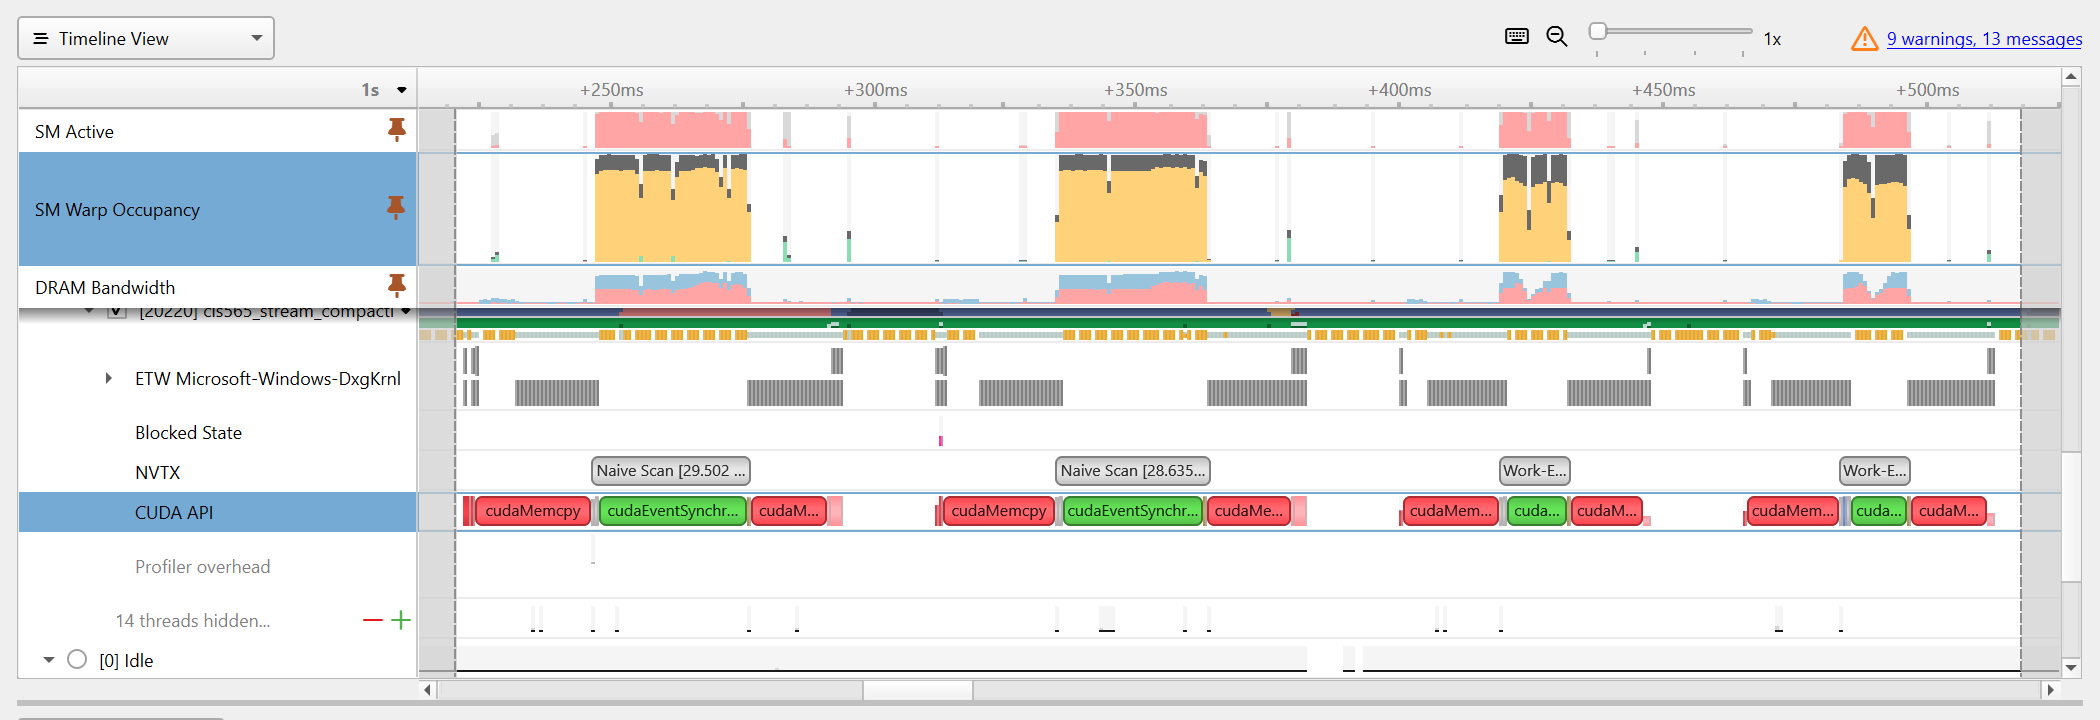
Nsight System Trace for Naive & Work-Efficient Implementation
- Nsight System Trace for Thrust Implementation
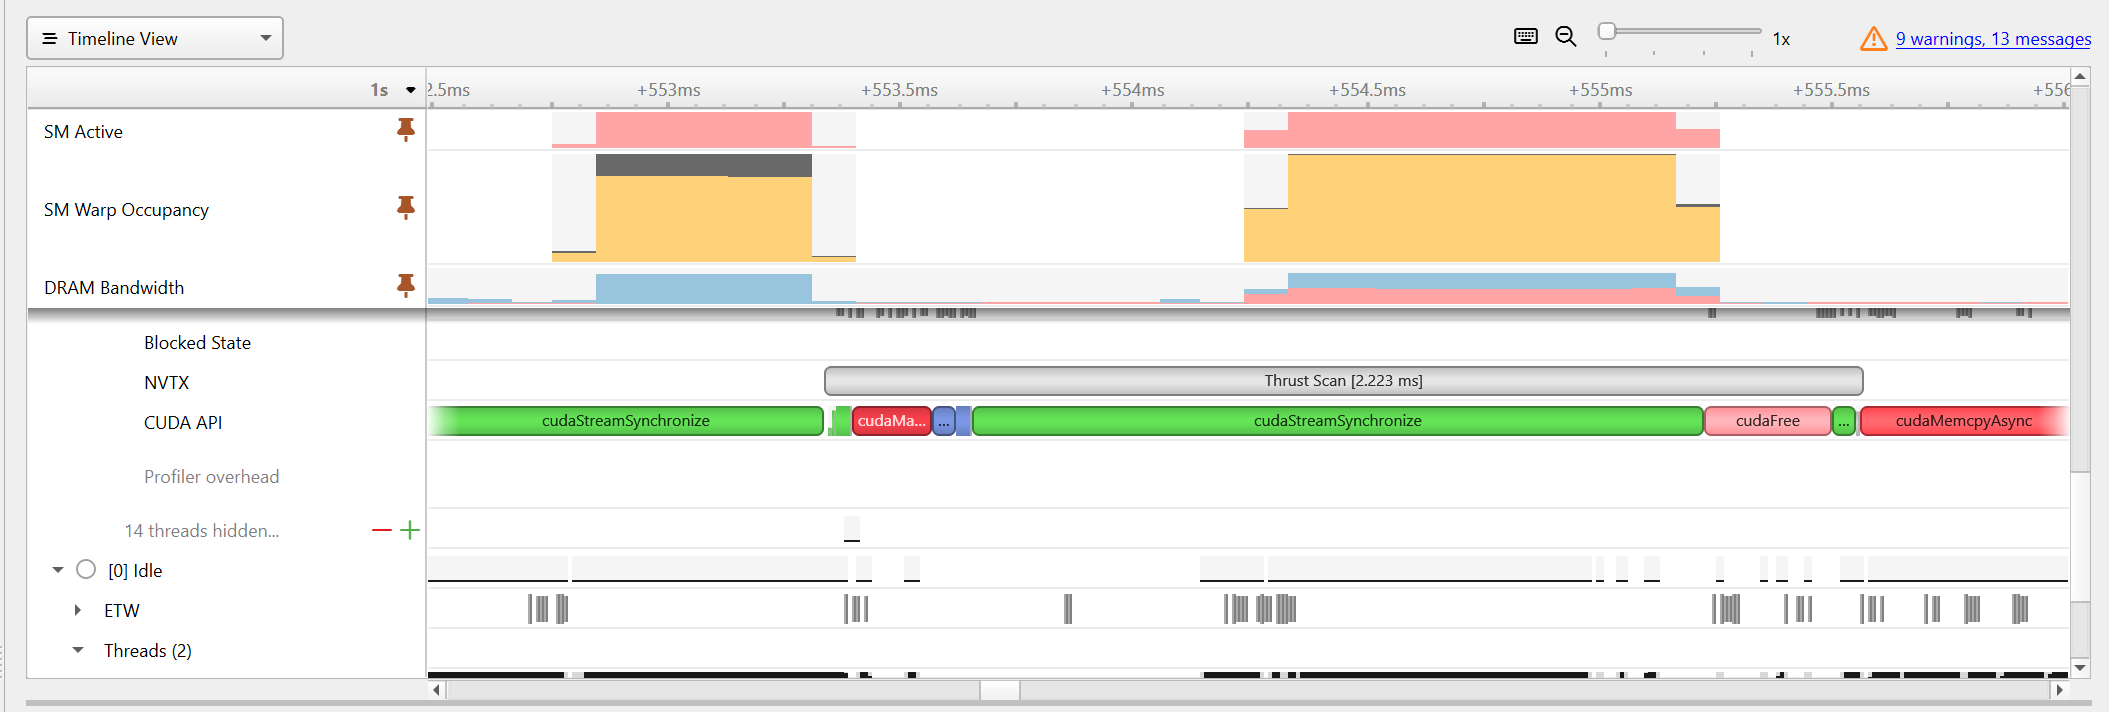
Nsight System Trace for Thrust Implementation
Naive GPU Implementation
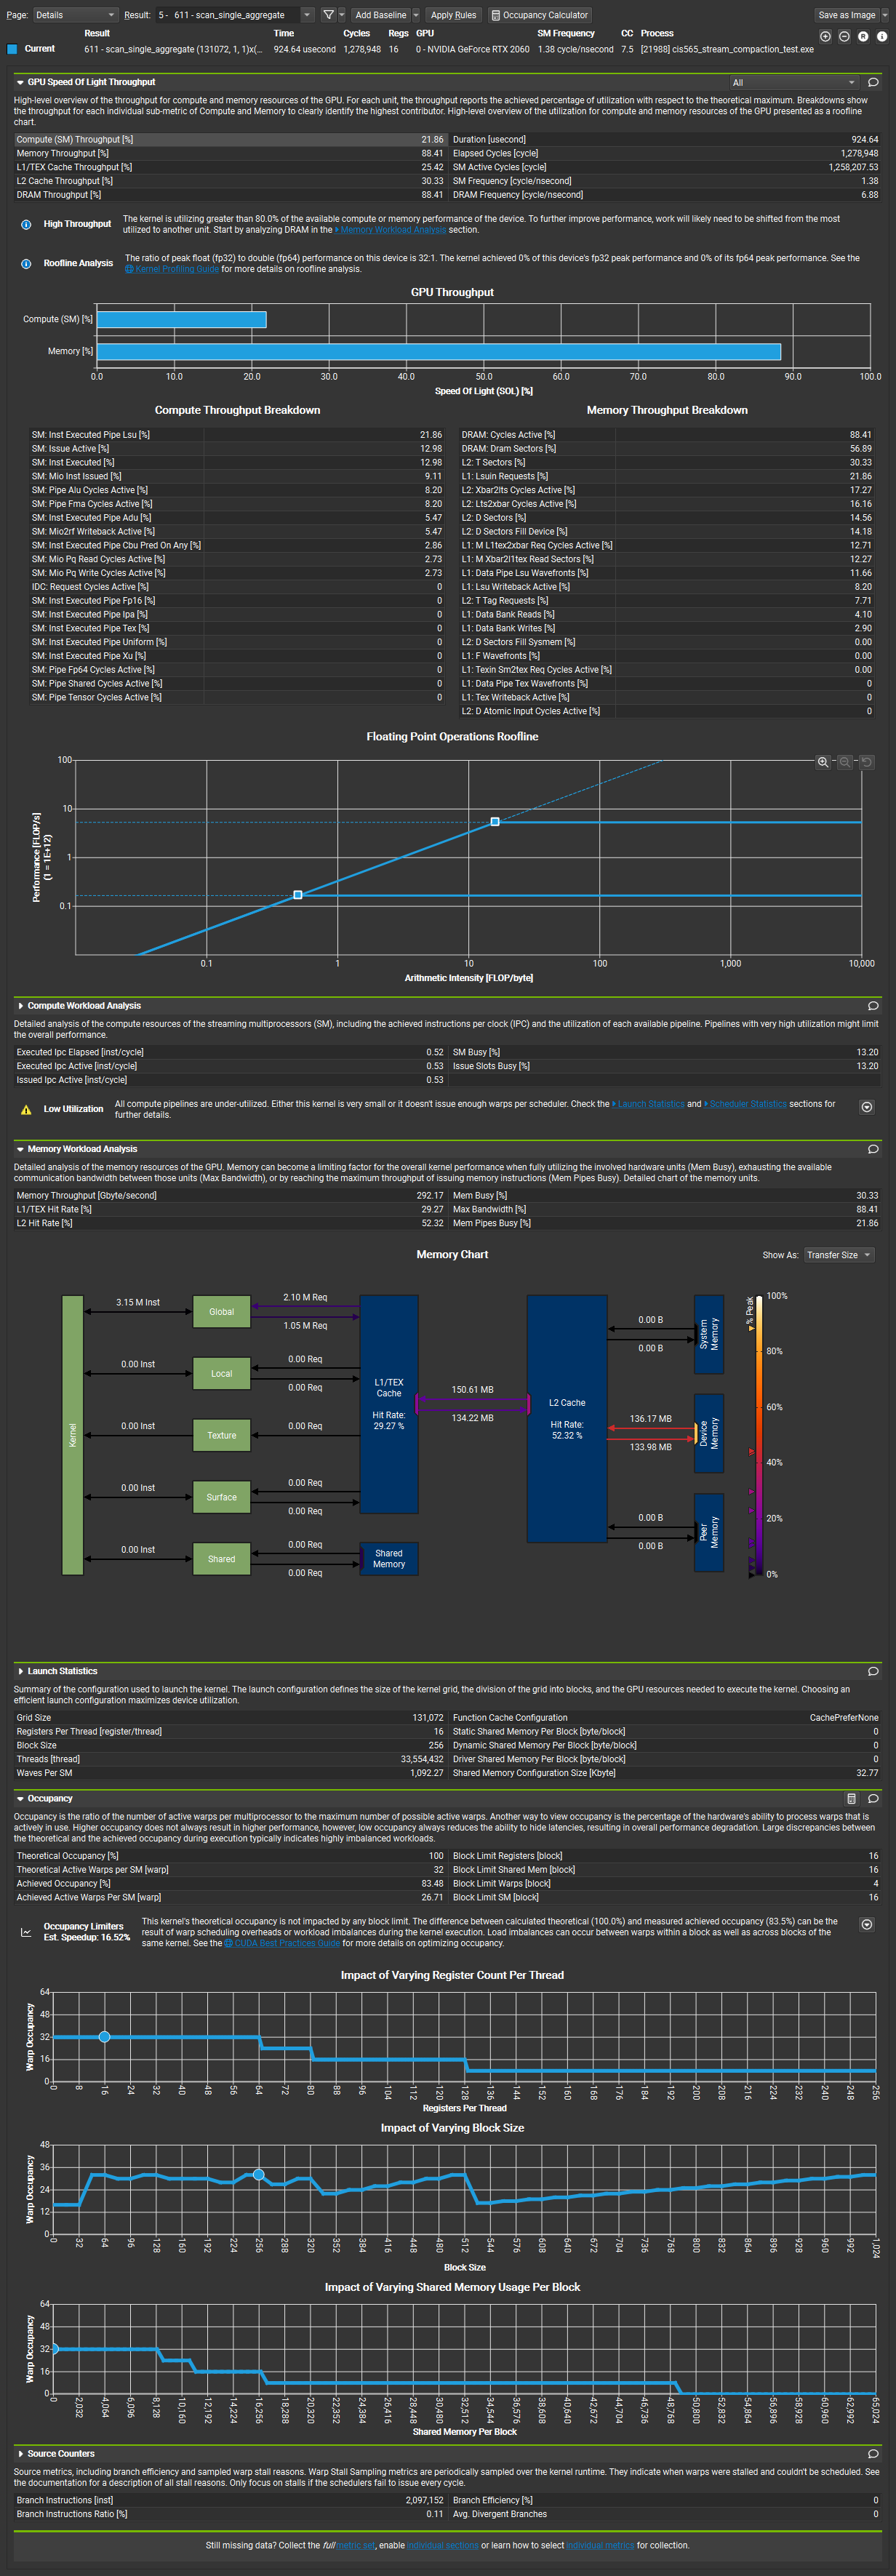
Nsight Compute Profile Result
Judging from the profile analysis of a single kernel invocation. The naive GPU implementation suffers the following problems:
- High memory usage and low SM usage. The SM throughput is only 21.86% while the memory throughput is at 88.41%. This means the naive implementation is likely to be bounded by memory, and experiences insufficient compute resource utilization.
- Inefficient memory access. Memory workload analysis shows only 29.27% hit rate on L1/TEX cache and the bandwidth between L2 Cache and Device Memory is over 40%. Since no shared memory is used for this implementation, frequent access to the device memory may cause performance loss.
Efficient GPU Implementation
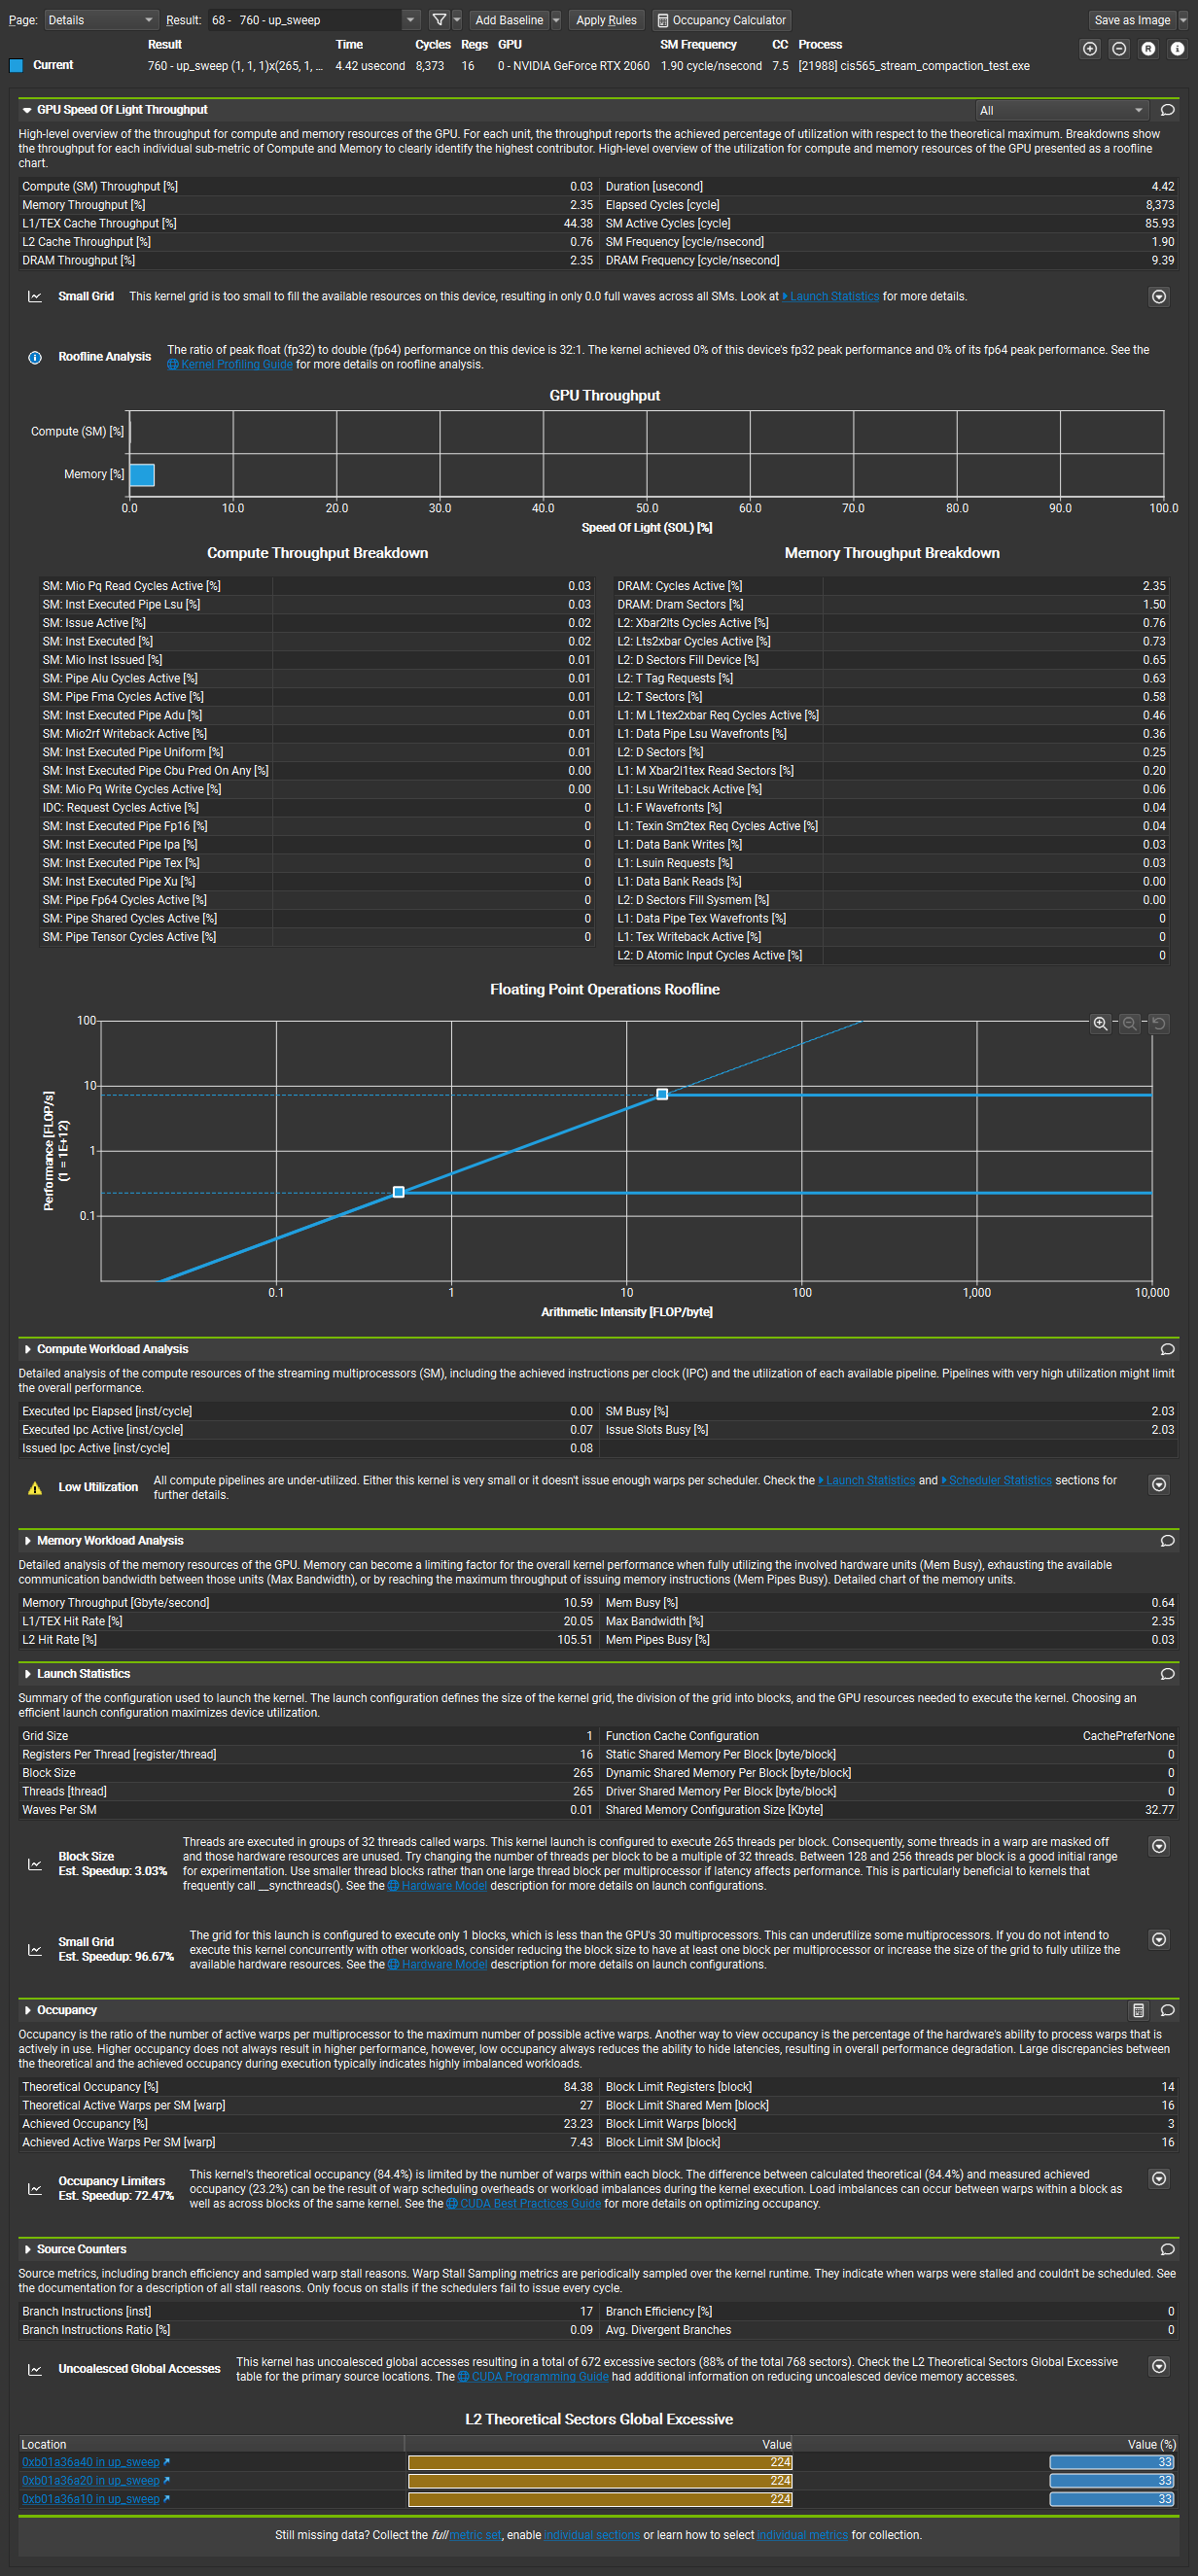
Nsight Compute Profile Result on Up-Sweep Kernel
Nsight Compute Profile Result on Down-Sweep Kernel
The up-sweep and down-sweep kernels all suffer the following problems:
- Low SM and Memory access. The reason Nsight Compute gives is that the grid is too small to fill the available resources. This is true in the sense that threads dispatched in each kernel invocation are doubled or halved, meaning that in many invocations, the number of threads is particularly small, and combined with a fixed block size that is 256, a large portion of threads are actually idle.
Thrust GPU Implementation
Based on Nsight System’s trace on memory / SM usage for the Thrust Implementation, The scan function of Thrust is very optimized with maximum SMs active and also very high SM warp occupancy. The naive and work-efficient implementations, however, dispite also having a high SM warp occupancy, has over 20% unallocated warps in SM.
There are several optimization aspects I can think of that Thrust uses to boost performance:
- Since there are gaps between SM usage within Thrust’s timeline, it might be possible that Thrust uses divide and conquer technique to break up the problem into smaller pieces to enchance performance.
- Optimal Block Sizes: Thrust might choose the optimum block size based on GPU and workload types, which maximizes hardware usage and occupancy.
- Optimal Memory Access: Thrust might use better memory coarsening to make sure access to global memory is coalesced, while also make use of shared memory and prefetching to boost memory efficiency.
4. Log Sample
Below is a log sample running on array of size \(2^{30}\).
****************
** SCAN TESTS **
****************
    [  11  12  37  10  15  24  35  11  24  21  49   5  17 ...   0   0 ]
==== cpu scan, power-of-two ====
   elapsed time: 394.874ms    (std::chrono Measured)
    [   0  11  23  60  70  85 109 144 155 179 200 249 254 ... 527930117 527930117 ]
==== cpu scan, non-power-of-two ====
   elapsed time: 448.757ms    (std::chrono Measured)
    [   0  11  23  60  70  85 109 144 155 179 200 249 254 ... 527930053 527930081 ]
    passed
==== naive scan, power-of-two ====
   elapsed time: 14634.9ms    (CUDA Measured)
    passed
==== naive scan, non-power-of-two ====
   elapsed time: 14747.1ms    (CUDA Measured)
    passed
==== work-efficient scan, power-of-two ====
   elapsed time: 418.342ms    (CUDA Measured)
    passed
==== work-efficient scan, non-power-of-two ====
   elapsed time: 417.047ms    (CUDA Measured)
    passed
==== thrust scan, power-of-two ====
   elapsed time: 516.865ms    (CUDA Measured)
    passed
==== thrust scan, non-power-of-two ====
   elapsed time: 477.864ms    (CUDA Measured)
    passed

*****************************
** STREAM COMPACTION TESTS **
*****************************
    [   2   2   3   2   0   1   2   1   3   0   1   2   1 ...   1   0 ]
==== cpu compact without scan, power-of-two ====
   elapsed time: 1982.29ms    (std::chrono Measured)
    [   2   2   3   2   1   2   1   3   1   2   1   1   2 ...   3   1 ]
    passed
==== cpu compact without scan, non-power-of-two ====
   elapsed time: 1984.63ms    (std::chrono Measured)
    [   2   2   3   2   1   2   1   3   1   2   1   1   2 ...   1   3 ]
    passed
==== cpu compact with scan ====
   elapsed time: 5014.15ms    (std::chrono Measured)
    [   2   2   3   2   1   2   1   3   1   2   1   1   2 ...   3   1 ]
    passed
==== work-efficient compact, power-of-two ====
   elapsed time: 31080.5ms    (CUDA Measured)
    passed
==== work-efficient compact, non-power-of-two ====
   elapsed time: 31348.9ms    (CUDA Measured)
    passed